scales::breaks_pretty()
Sarah Gothard
In this document, I will introduce the breaks_pretty() function and show what it’s for.
library(tidyverse)## Warning: package 'tidyverse' was built under R version 4.0.3## -- Attaching packages --------------------------------------- tidyverse 1.3.0 --## v ggplot2 3.3.3 v purrr 0.3.4
## v tibble 3.0.6 v dplyr 1.0.4
## v tidyr 1.1.2 v stringr 1.4.0
## v readr 1.4.0 v forcats 0.5.1## Warning: package 'ggplot2' was built under R version 4.0.3## Warning: package 'tibble' was built under R version 4.0.3## Warning: package 'tidyr' was built under R version 4.0.3## Warning: package 'readr' was built under R version 4.0.3## Warning: package 'purrr' was built under R version 4.0.3## Warning: package 'dplyr' was built under R version 4.0.3## Warning: package 'stringr' was built under R version 4.0.3## Warning: package 'forcats' was built under R version 4.0.3## -- Conflicts ------------------------------------------ tidyverse_conflicts() --
## x dplyr::filter() masks stats::filter()
## x dplyr::lag() masks stats::lag()library(palmerpenguins)## Warning: package 'palmerpenguins' was built under R version 4.0.3library(scales)## Warning: package 'scales' was built under R version 4.0.3##
## Attaching package: 'scales'## The following object is masked from 'package:purrr':
##
## discard## The following object is masked from 'package:readr':
##
## col_factordata(penguins)The “breaks_pretty” function is used to find best fit “breaks” or intervals in a data set.
#creating simple breaks in a month
one_month <- as.POSIXct(c("2020-05-01", "2020-06-01"))
demo_datetime(one_month, breaks = breaks_pretty(2))
## scale_x_datetime(breaks = breaks_pretty(2))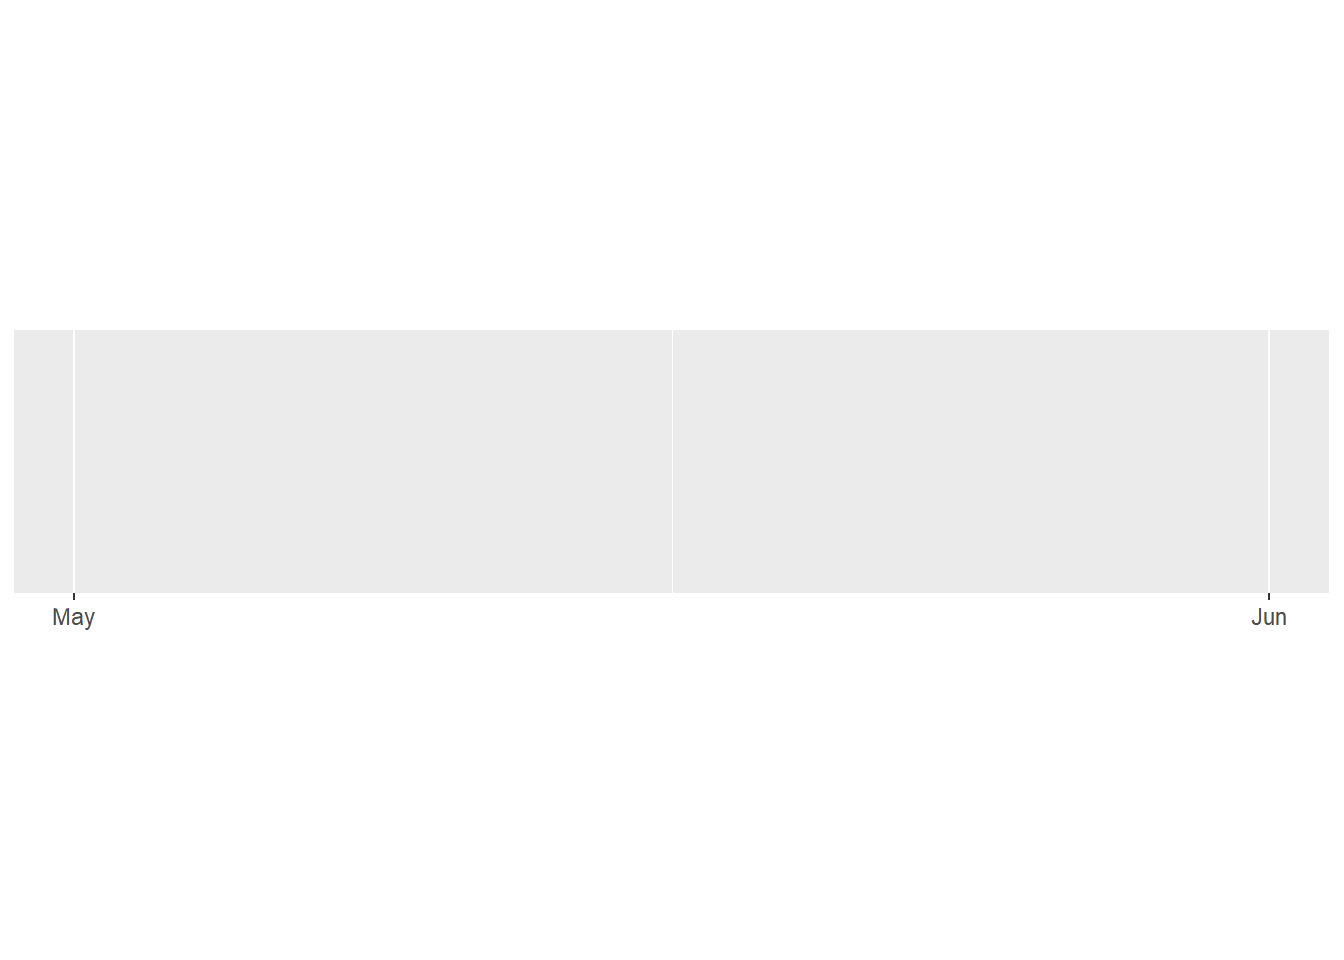
demo_datetime(one_month, breaks = breaks_pretty(4))## scale_x_datetime(breaks = breaks_pretty(4))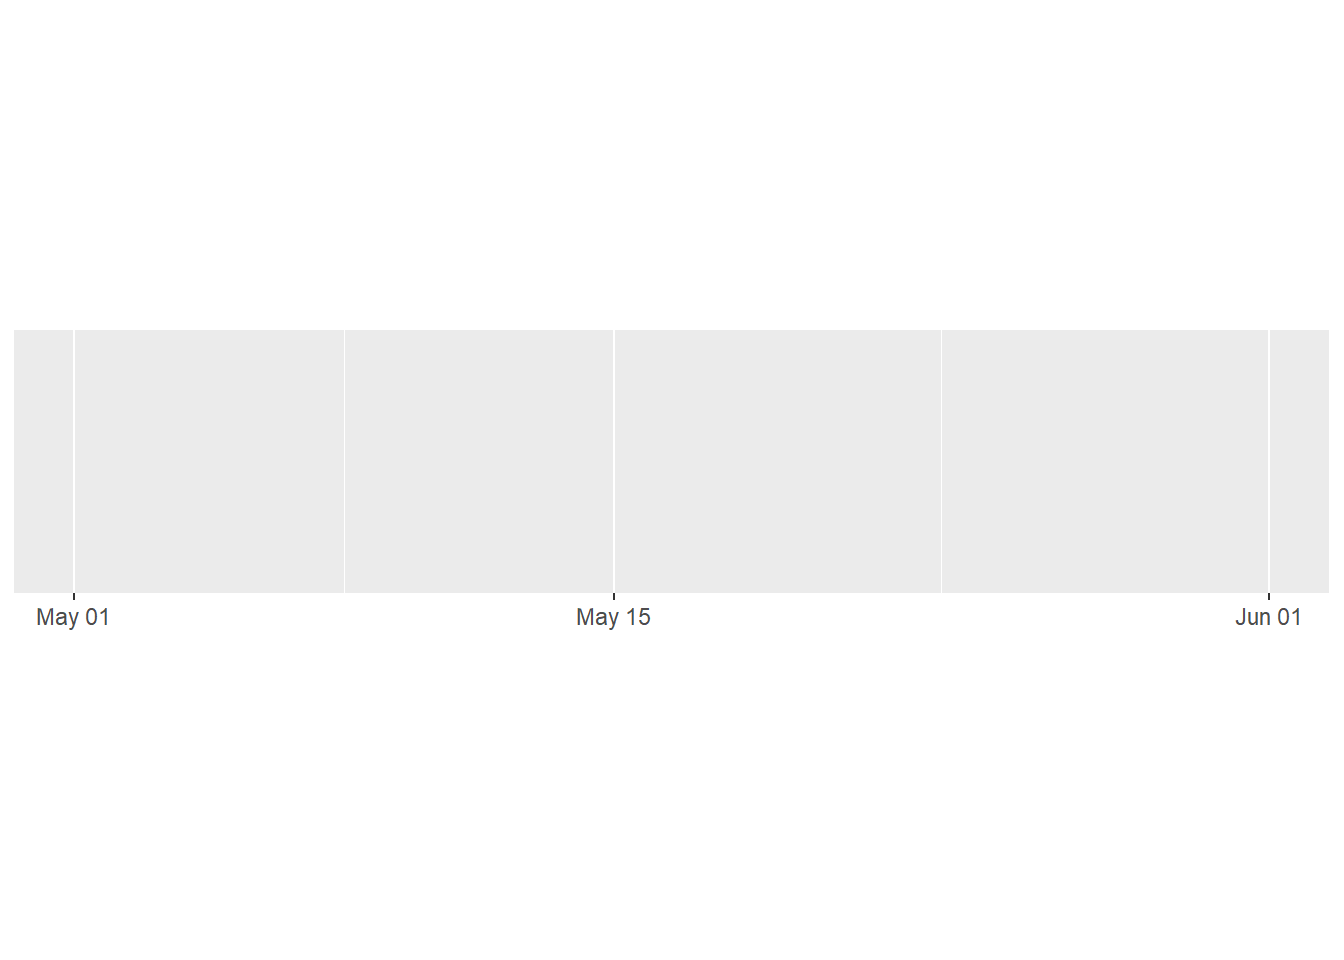
#more complex breaks and/or data sets will sometimes lead to greater or fewer intervals than desgnated by your "n" because the breaks_pretty package intuitively finds breaks near your desired number of intervals that fits the data assigned best.

demo_datetime(one_month, breaks = breaks_pretty(12))
## scale_x_datetime(breaks = breaks_pretty(12))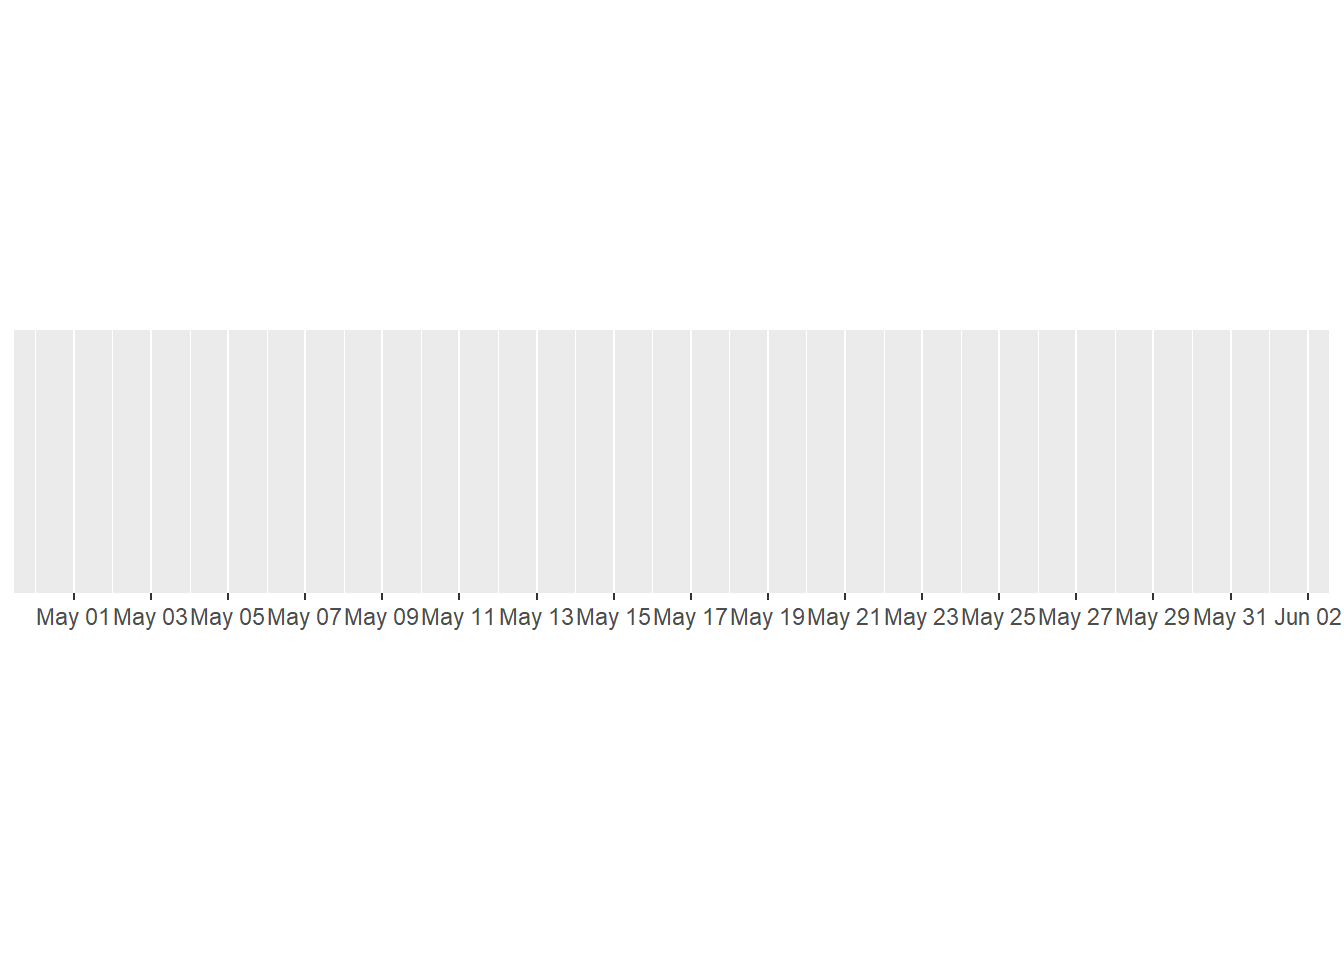
#output has more than 12 breaksFunciton Discussion and Use
Breaks_pretty is found in the “scales” package and takes advantage of an existing r package/algorithm, “pretty()”. In practice, breaks_pretty() is most commonly used to designate the tics/intervals of dates/times/continuous variables in ggplot visualizations.
#when using breaks_pretty() add you can either designate your argument's n explicity, (n = 6) or it defaults to that as the first argument and pass in just the number of breaks you'd like to see (6).

ggplot(penguins,
       aes(x = bill_length_mm,
           y = body_mass_g)) +
  geom_point() +
  geom_smooth() +
  scale_x_continuous(name = "Bill Length (mm)",
                     breaks = breaks_pretty(6)) +     # breaks_pretty
  scale_y_continuous(name = "Body Mass (g)",
                     breaks = breaks_pretty(n = 8)) +
  theme_light()
## `geom_smooth()` using method = 'loess' and formula 'y ~ x'## Warning: Removed 2 rows containing non-finite values (stat_smooth).## Warning: Removed 2 rows containing missing values (geom_point).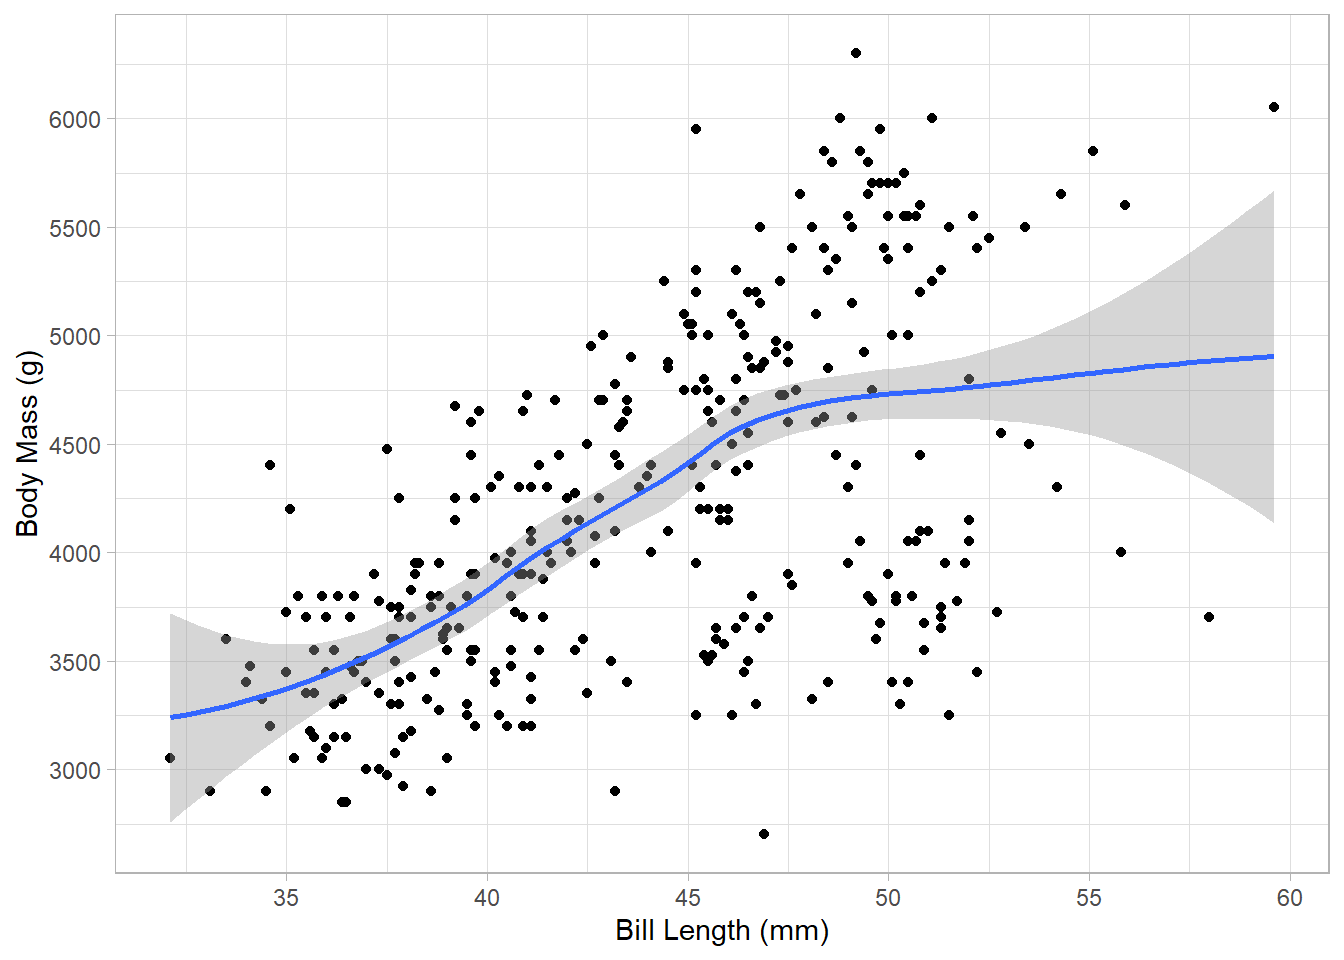
Is it helpful?
Breaks_pretty is very useful as it simplifies how we desginate intervals (tics) in our ggplots. Instead of hardcoding the intervals we want to see, breaks_pretty intuitively designates tics close to our desired widths.