{patchwork} package
Becky Kempton
In this document, I will introduce the patchwork function and show what it’s for.
#load dplyr up
library(ggplot2)
## Warning: package 'ggplot2' was built under R version 4.0.3library(patchwork)
library(readxl)## Warning: package 'readxl' was built under R version 4.0.3library(tidyverse)## Warning: package 'tidyverse' was built under R version 4.0.3## -- Attaching packages --------------------------------------- tidyverse 1.3.0 --## v tibble 3.0.6 v dplyr 1.0.4
## v tidyr 1.1.2 v stringr 1.4.0
## v readr 1.4.0 v forcats 0.5.1
## v purrr 0.3.4## Warning: package 'tibble' was built under R version 4.0.3## Warning: package 'tidyr' was built under R version 4.0.3## Warning: package 'readr' was built under R version 4.0.3## Warning: package 'purrr' was built under R version 4.0.3## Warning: package 'dplyr' was built under R version 4.0.3## Warning: package 'stringr' was built under R version 4.0.3## Warning: package 'forcats' was built under R version 4.0.3## -- Conflicts ------------------------------------------ tidyverse_conflicts() --
## x dplyr::filter() masks stats::filter()
## x dplyr::lag() masks stats::lag()library(dplyr)
#dataset from tidytuesday
items <- readr::read_csv('https://raw.githubusercontent.com/rfordatascience/tidytuesday/master/data/2020/2020-05-05/items.csv')##
## -- Column specification --------------------------------------------------------
## cols(
## num_id = col_double(),
## id = col_character(),
## name = col_character(),
## category = col_character(),
## orderable = col_logical(),
## sell_value = col_double(),
## sell_currency = col_character(),
## buy_value = col_double(),
## buy_currency = col_character(),
## sources = col_character(),
## customizable = col_logical(),
## recipe = col_double(),
## recipe_id = col_character(),
## games_id = col_character(),
## id_full = col_character(),
## image_url = col_character()
## )## Warning: 2 parsing failures.
## row col expected actual file
## 4472 customizable 1/0/T/F/TRUE/FALSE Yes 'https://raw.githubusercontent.com/rfordatascience/tidytuesday/master/data/2020/2020-05-05/items.csv'
## 4473 customizable 1/0/T/F/TRUE/FALSE Yes 'https://raw.githubusercontent.com/rfordatascience/tidytuesday/master/data/2020/2020-05-05/items.csv'#Animal Crossing, Items dataset
#View(items)items_filter<-items%>%
arrange(buy_value)%>% #From Part 3 in class and,
filter(buy_currency == "bells",
!is.na(buy_value), #From R for Data Science.
!is.na(sources))
items_select<-items_filter%>%
select(name,category,sources,buy_value)
items_select2<-items_select[-c(600,601,602,603,604,605,606,607,608),]What is it for?
Discuss what the function does. Learn from the examples, but show how to use it using another dataset such as
penguins.
From Help: This function is helpful particularly when dealing with the composition of multiple plots. This function is so easy to use by combining separate ggplots into the same graphic. It is mostly used with ggplot and helps properly align graphs regardless of their complexity.
You can add plots together that have the same y-axis variable as shown in the 2 examples below.
items1<-ggplot(items_select2) + geom_point(aes(category, buy_value))+
  scale_y_continuous(labels = scales::dollar_format())+                   #https://datavizpyr.com/dollar-format-for-axis-labels-with-ggplot2/
  theme(axis.text.x = element_text(angle = 90, vjust = 0.5, hjust=1))+     #stackoverflow
  labs(title = "Items by Category",
       x = "Item Name",
       y = "Buy Value in Bells")

items2<-ggplot(items_select2) + geom_boxplot(aes(sources, buy_value))+
  scale_y_continuous(labels = scales::dollar_format())+
  theme(axis.text.x = element_text(angle = 90, vjust = 0.5, hjust=1))+
labs(title = "Items by Source",
       x = "Item Name",
       y = "Buy Value in Bells")

items1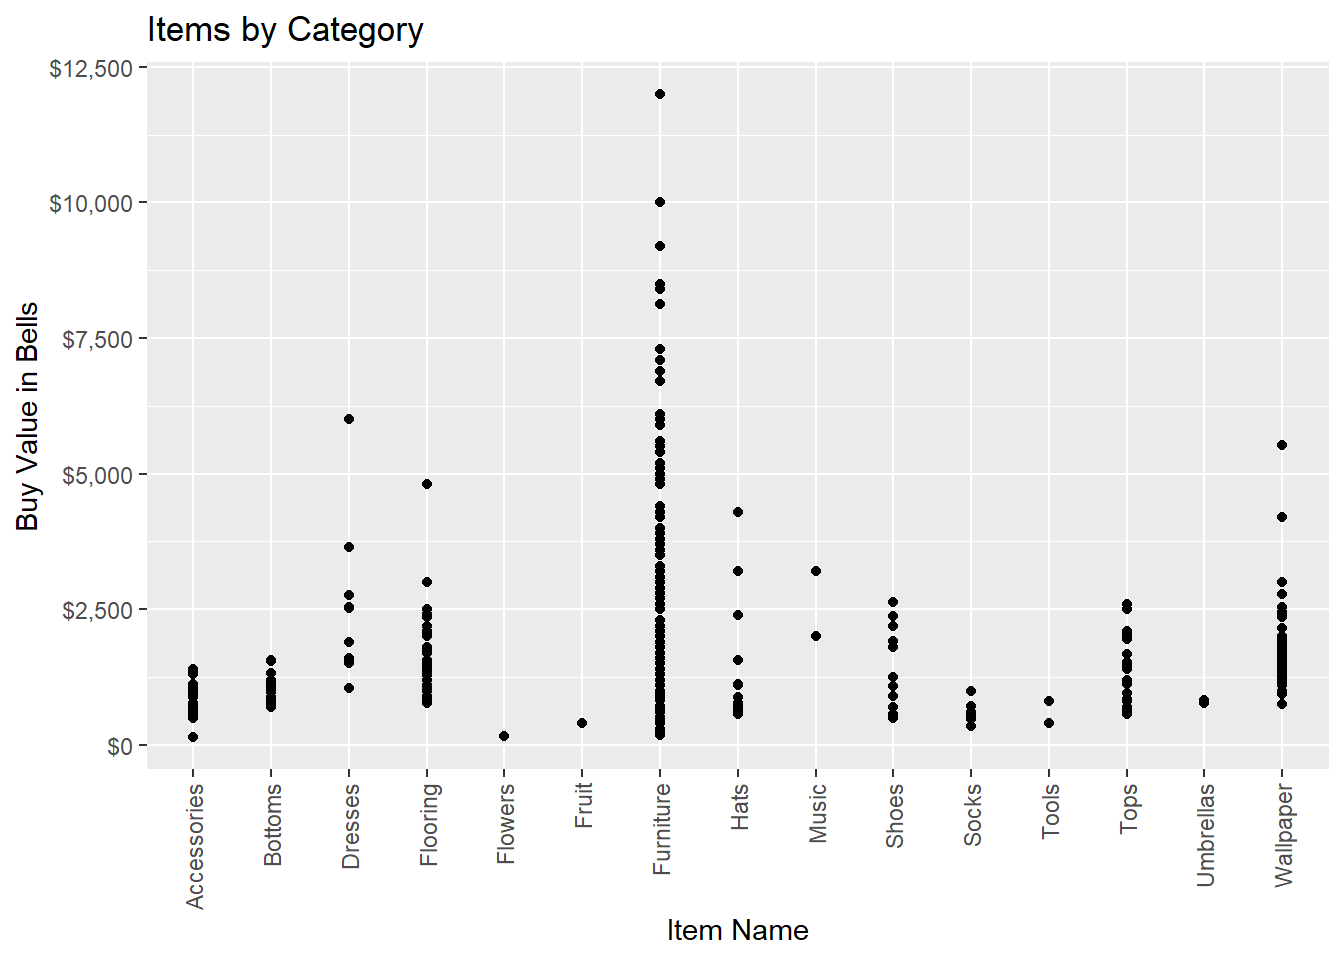
items2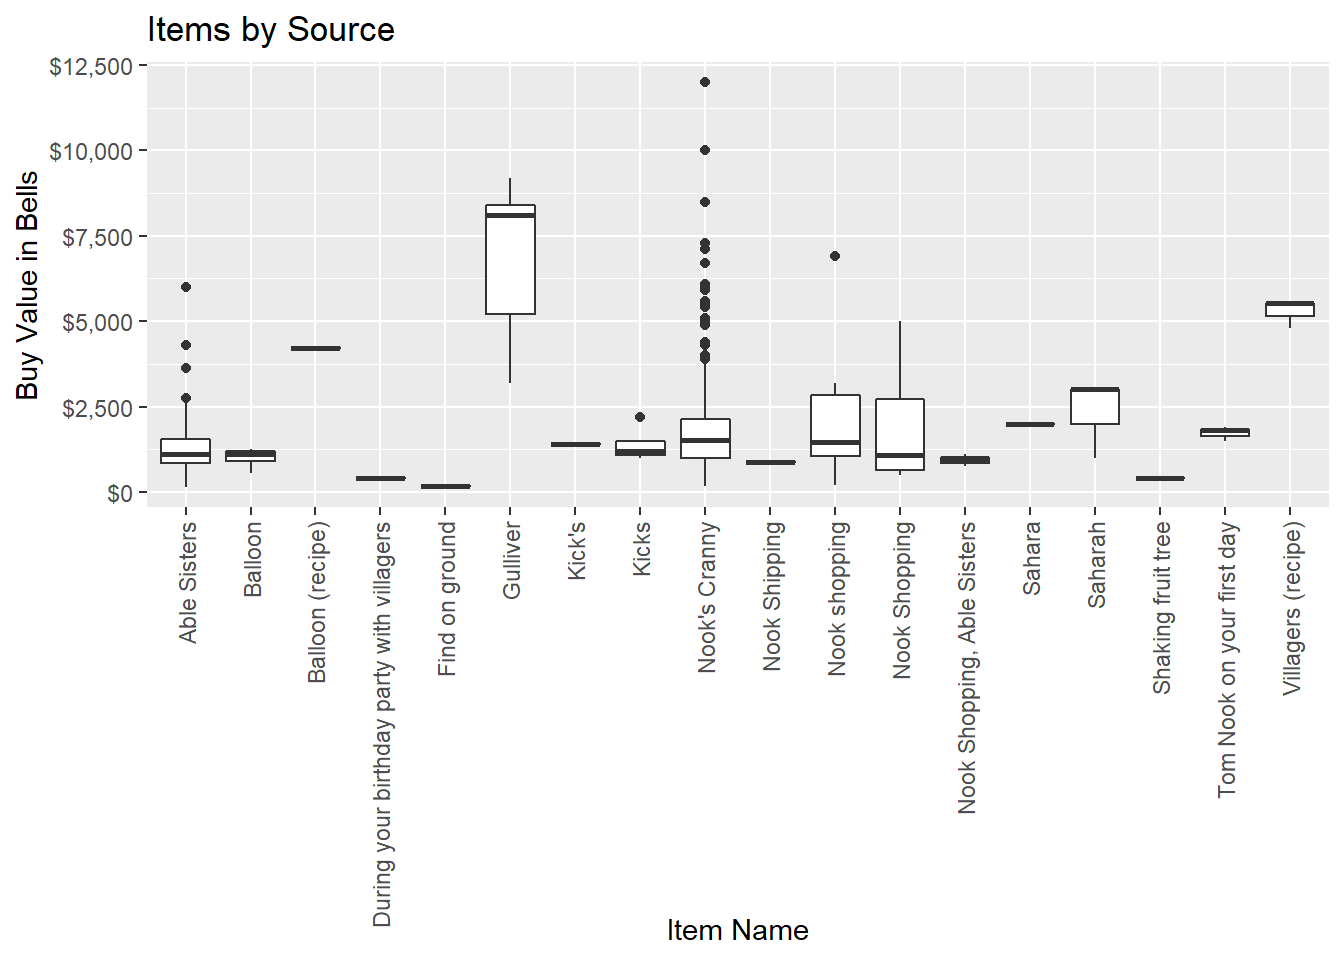
items1+items2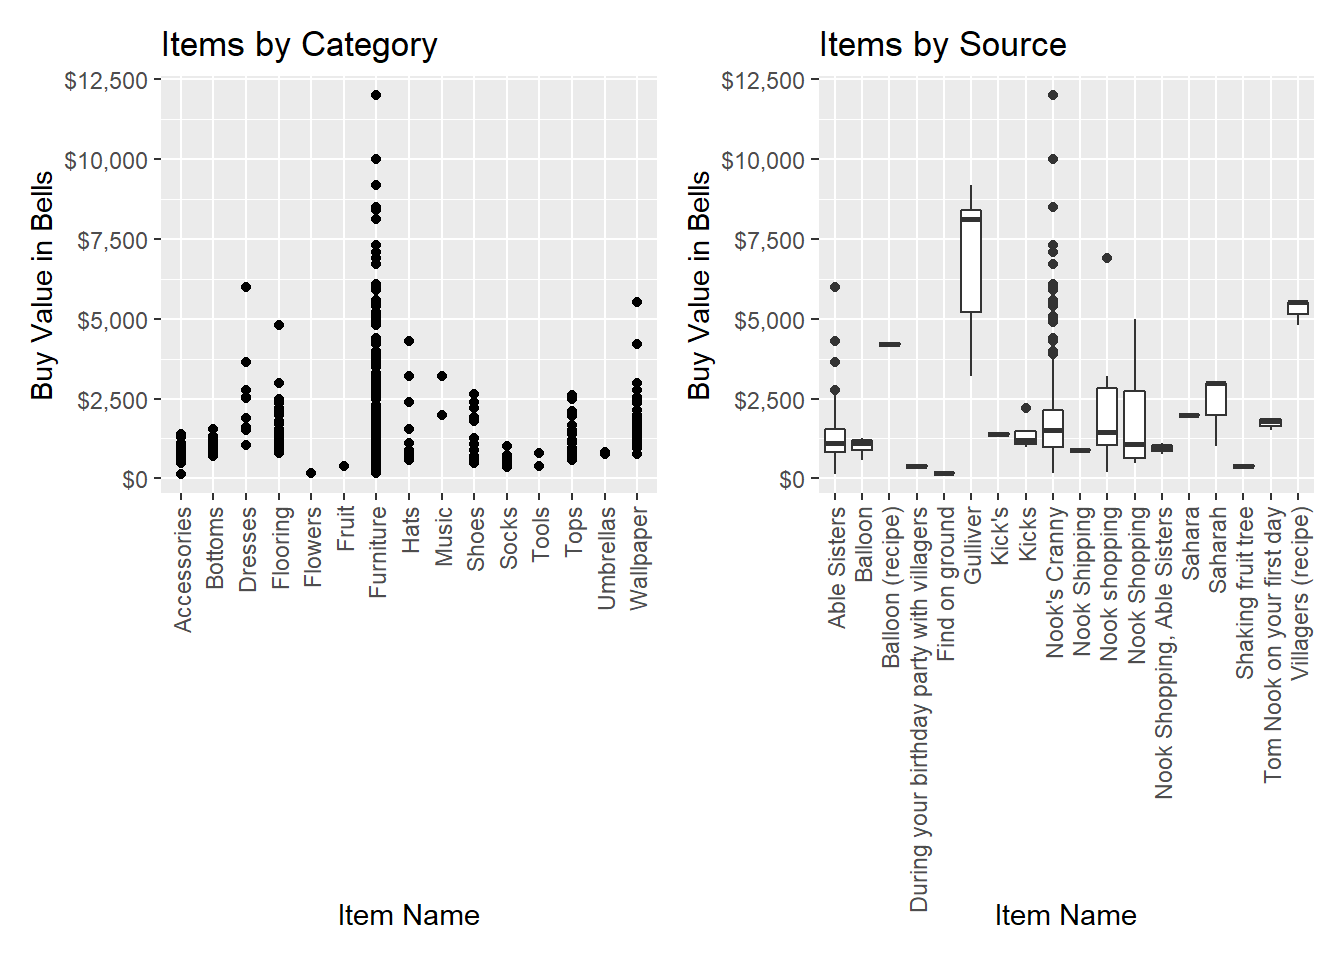
p1 <- ggplot(mtcars) + geom_point(aes(mpg, disp))                   #these plots came from https://patchwork.data-imaginist.com/
p2 <- ggplot(mtcars) + geom_boxplot(aes(gear, disp, group = gear))  #using the mtcars data.

p1 + p2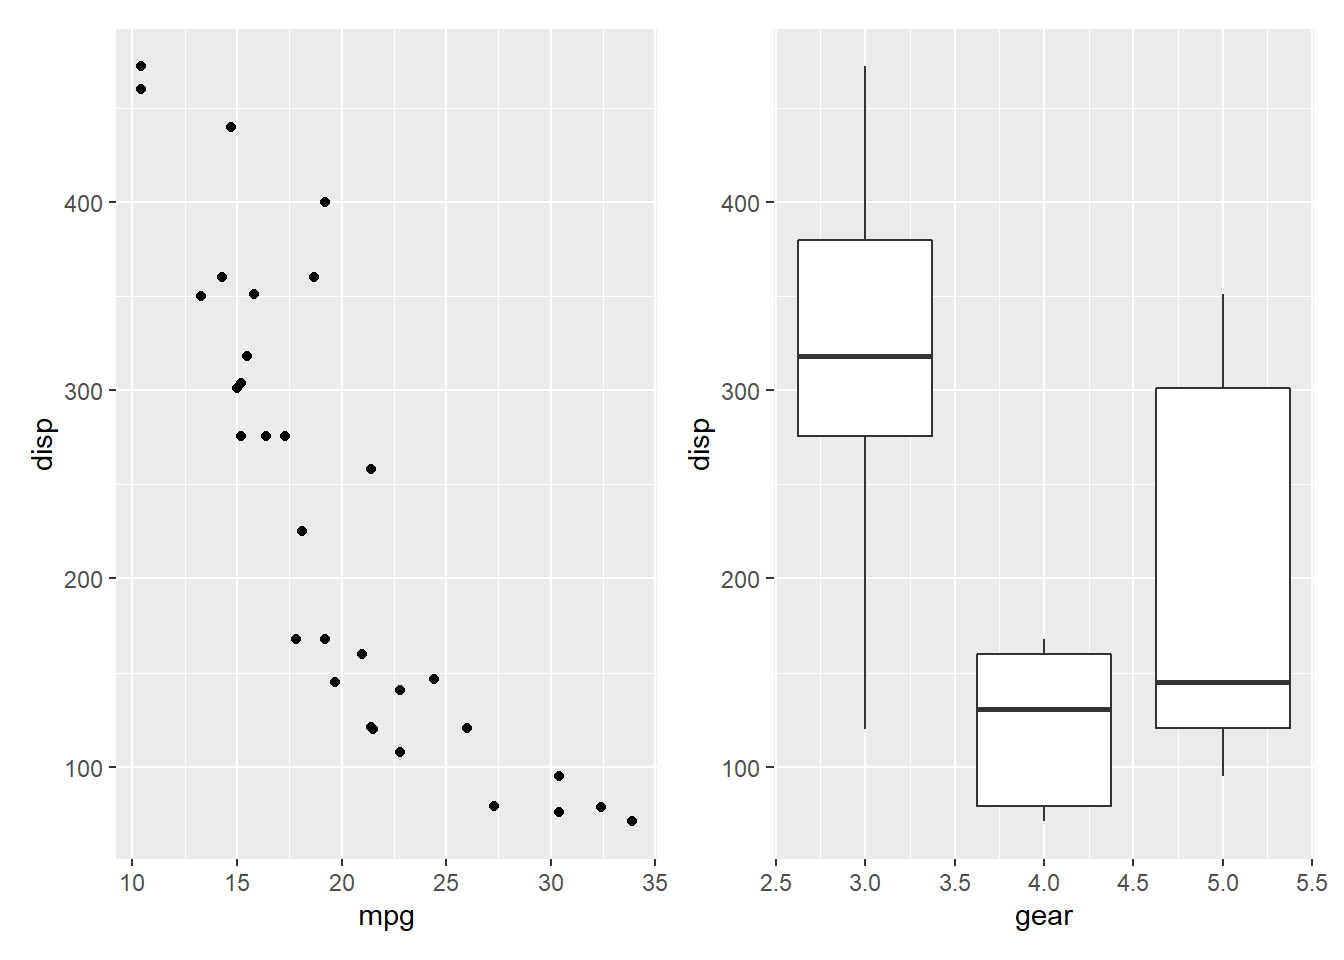
“Patchwork can also provide a rich support for arbitrary complex layouts with full alignment.” -https://patchwork.data-imaginist.com/ This is shown in the example below where mathematical operators are used to combine multiple plots.
p1 / p2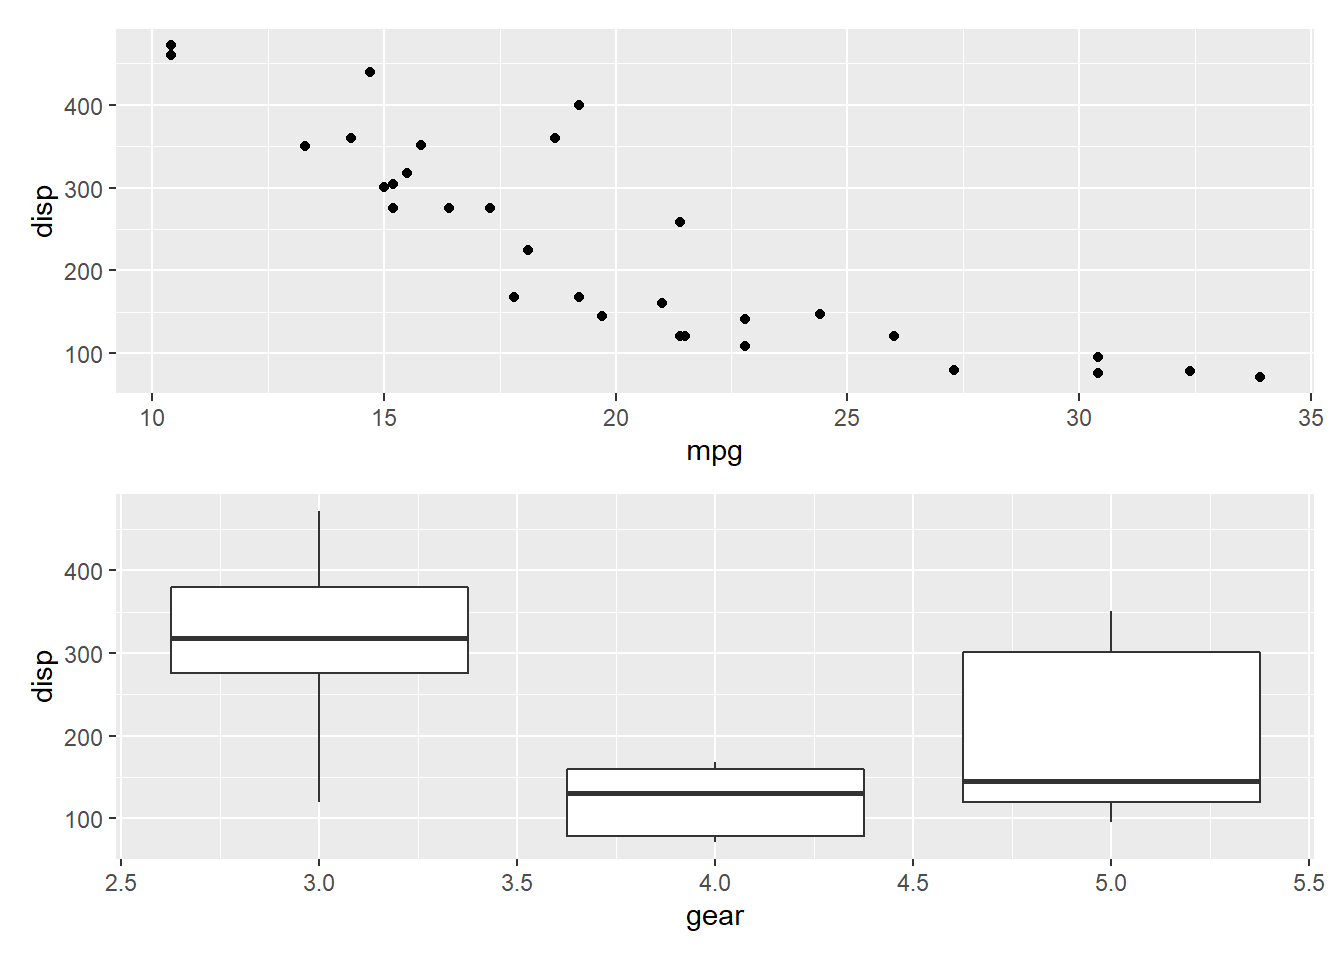
p3 <- ggplot(mtcars) + geom_smooth(aes(disp, qsec))                      #https://patchwork.data-imaginist.com/
p4 <- ggplot(mtcars) + geom_bar(aes(carb))

(p1 | p2 | p3) /
      p4
## `geom_smooth()` using method = 'loess' and formula 'y ~ x'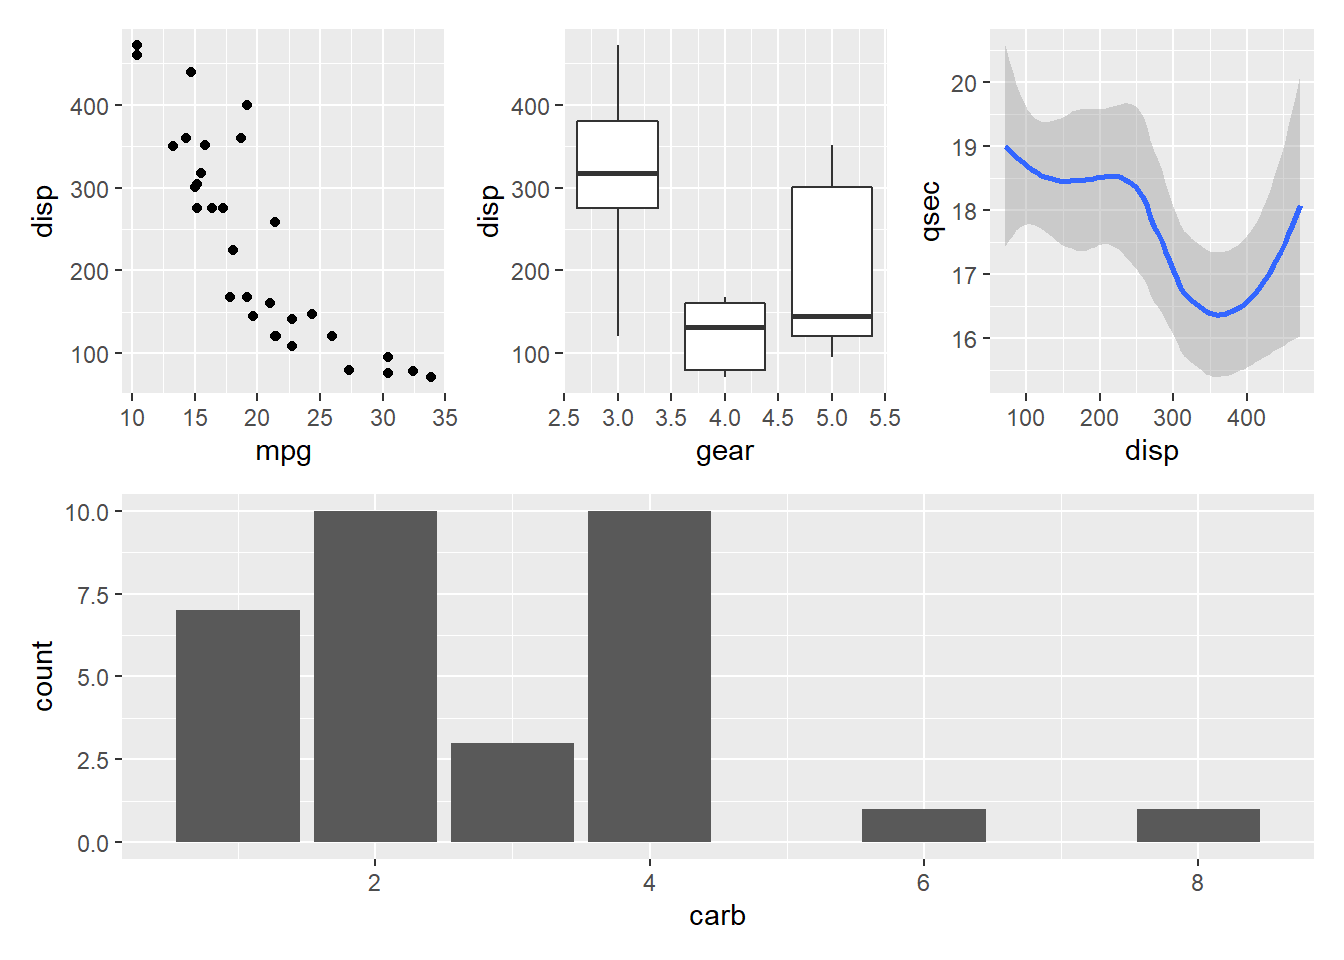
Is it helpful?
Discuss whether you think this function is useful for you and your work. Is it the best thing since sliced bread, or is it not really relevant to your work?
I really like this function and find it useful. I think knowing this function would have been incredibly helpful on so many Biostats assignments by just making my assignments look more organized and coherent. Is it the best thing since sliced bread? Close, that is a hard thing to accomplish in my books but this function comes incredibly close to those standards. I will definitely be using this function in the future.